Blog Post

Homes More Affordable Today than 1985-2000

  • By Christine Wren
  • 05 Jul, 2018

This is a subtitle for your new post

Rising home prices have many concerned that the average family will no longer be able to afford the most precious piece of the American Dream – their own home.

However, it is not just the price of a home that determines its affordability. The monthly cost of a home is determined by the price and the interest rate on the mortgage used to purchase it.

Today, mortgage interest rates stand at about 4.5%. The average annual mortgage interest rate from 1985 to 2000 was almost double that number, at 8.92%. When comparing affordability of homeownership over the decades, we must also realize that incomes have increased.

This is why most indexes use the percentage of median income required to make monthly mortgage payments on a typical home as the point of comparison.

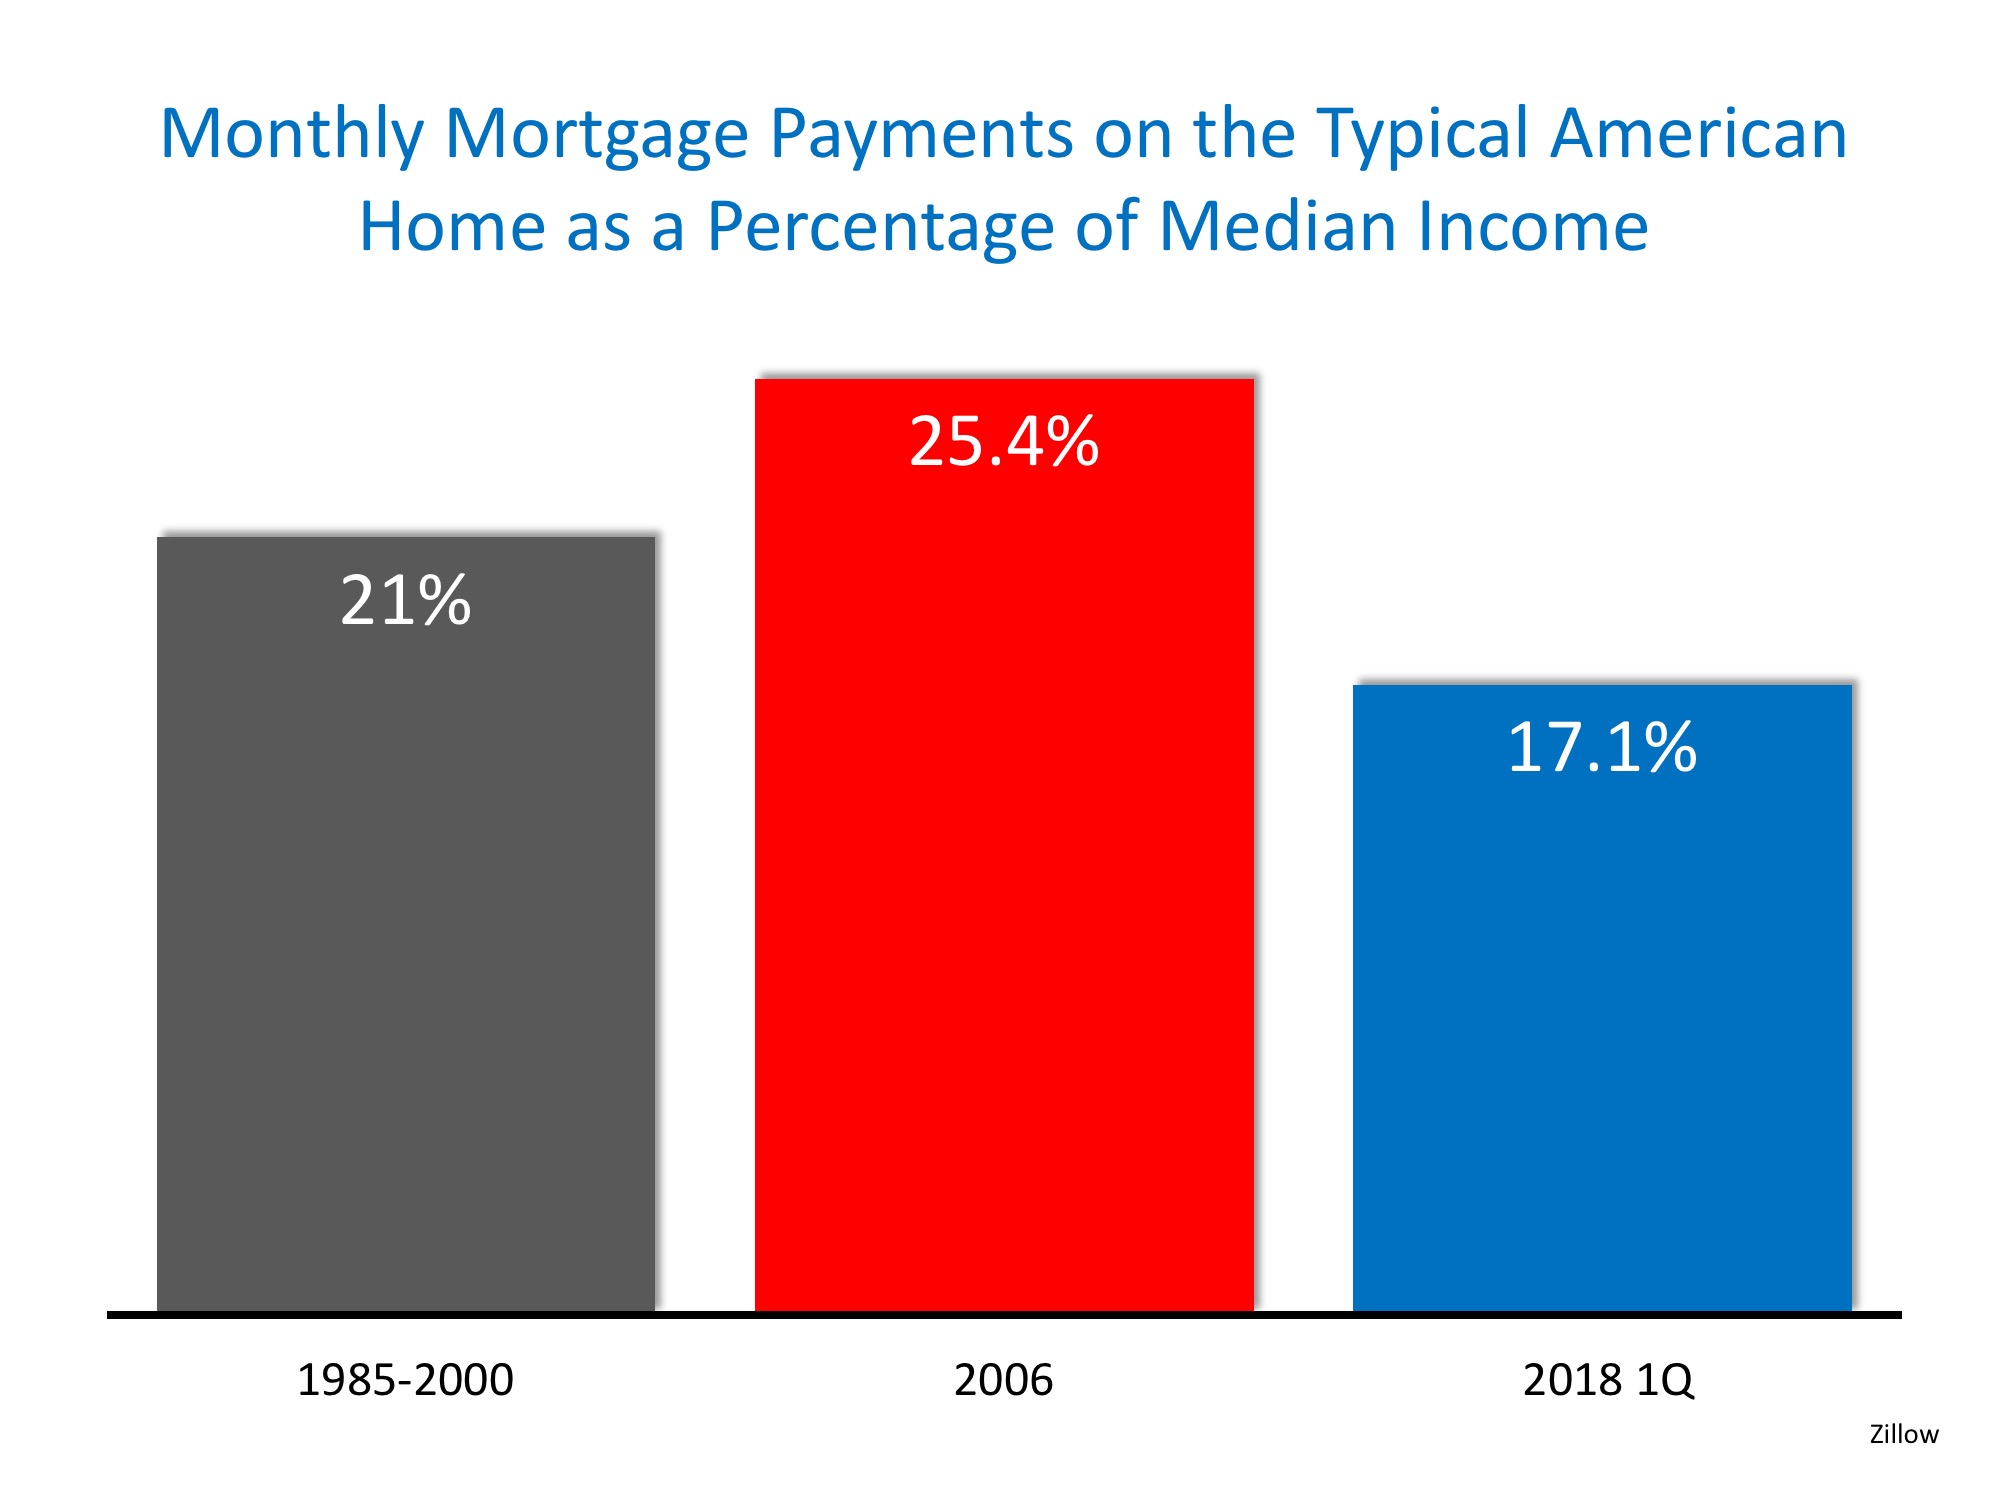
Zillow recently released a report comparing home affordability over the decades using this formula. The report revealed that, though homes are less affordable this year than last year, they are more affordable today (17.1%) than they were between 1985-2000 (21%). Additionally, homes are more affordable now than at the peak of the housing bubble in 2006 (25.4%). Here is a chart of these findings:

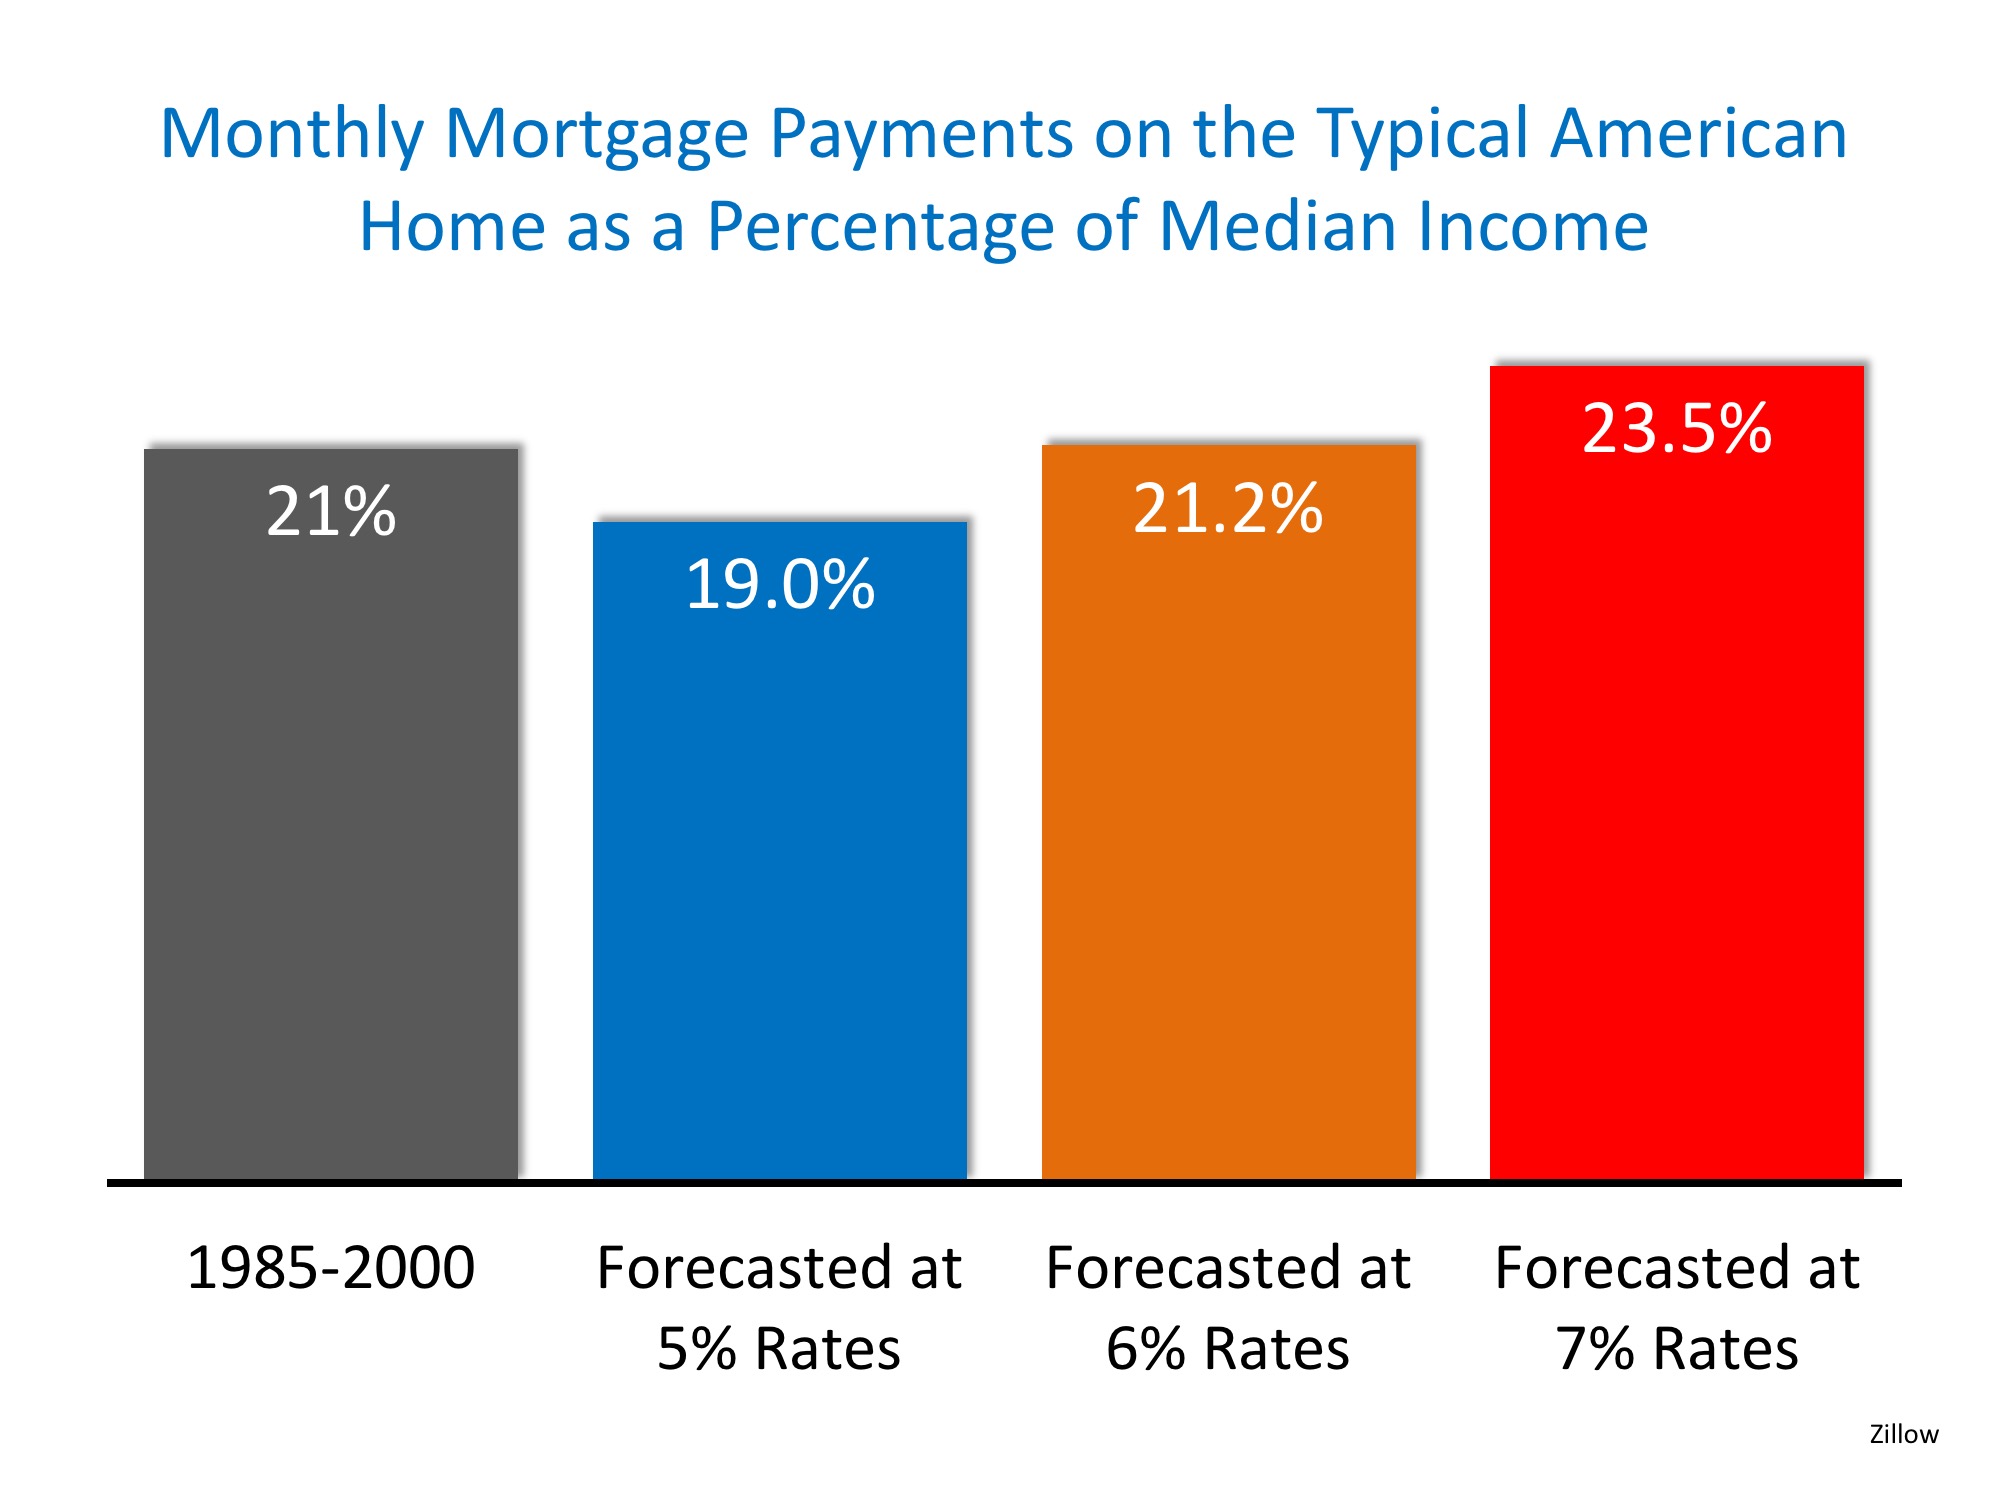
What will happen when mortgage interest rates rise?

Most experts think that the mortgage interest rate will increase to about 5% by year’s end. How will that impact affordability? Zillow also covered this in their report:

Rates would need to approach 6% before homes became less affordable than they had been historically.

Bottom Line

Though homes are less affordable today than they were last year, they are still a great purchase while interest rates are below the 6% mark.

By Christine Wren October 11, 2018
We have all seen the headlines that report that buying a home is less affordable today than it was at any other time in the last ten years, and those headlines are accurate. But, have you ever wondered why the headlines don’t say the last 25 years, the last 20 years, or even the last 11 years?
By Christine Wren October 10, 2018
According to the latest New Residential Sales Report from the Census Bureau, new construction sales in August were up 3.5% from July and 12.7% from last year! This marks the second consecutive month with double-digit year-over-year growth (12.8% in July).
By Christine Wren October 9, 2018
According to CoreLogic’s latest Home Price Insights Report, national home prices in August were up 5.5% from August 2017. This marks the first time since June 2016 that home prices did not appreciate by at least 6.0% year-over-year.
By Christine Wren October 8, 2018
Owning a home has great financial benefits, yet many continue to rent! Today, let’s look at the financial reasons why owning a home of your own has been a part of the American Dream for the entirety of America’s existence.
By Christine Wren, Realtor®, Certified International Property Specialist September 25, 2018
The Austin Board of Realtors released new monthly housing data on Tuesday and, surprise, August was another one for the record books. The median home price for the City of Austin was $393,000.
By Source: “Important Amenities,” Porch.com (September 2018) September 24, 2018

Home shoppers are unwilling to negotiate on certain amenities, and prime among them are central air conditioning and a private patio or backyard, according to a new survey of more than 1,000 homeowners conducted by remodeling site Porch.com. On the other hand, prospective buyers are less likely to consider stainless steel appliances or a swimming pool as deal-breaking must-haves.

Renters and homeowners differ quite a bit in their priorities, the survey found. While homeowners ranked central air, private backyard areas, and guest bedrooms as high priorities, renters ranked central air, an in-unit washer and dryer, and pet-friendly building policies as their top amenities.


By Christine Wren September 24, 2018
Home values have risen dramatically over the last twelve months. In CoreLogic’s most recent Home Price Index Report, they revealed that national home prices have increased by 6.2% year-over-year. CoreLogic broke down appreciation even further into four price ranges, giving us a more detailed view than if we had simply looked at the year-over-year increases in national median home price. The chart below shows the four price ranges from the report, as well as each one’s year-over-year growth from July 2017 to July 2018 (the latest data available).
By Christine Wren September 17, 2018
f you thought about selling your house this year, now more than ever may be the time to do it! The inventory of homes for sale is well ...
By Christine Wren September 13, 2018
For the last several years, buyer demand has far exceeded the housing supply available for sale. This low supply and high demand have led to home prices appreciating by an average of 6.2% annually since 2012. With this being said, three of the four major reports used to measure buyer activity have revealed that purchasing demand may be softening. Here are the four indices, how they measure demand (methodology), what their latest reports said, and a quick synopsis of the report.
By Christine Wren September 11, 2018
We all realize that the best time to sell anything is when the demand for that item is high and the supply of that item is limited. The last two major reports issued by the National Association of Realtors (NAR) revealed information that suggests that right now continues to be a great time to sell your house. Let’s look at the data covered in the latest Pending Home Sales Report and Existing Home Sales Report.
More Posts
Share by: